Python in service of reproducibility
by Rita Zágoni
The degree to which certain aspects of a research are reproducible depend on many factors. For intstance, in a complex research workflow it is hard to automate all the steps ranging from data preparation through analysis to packaging of data and code. Reducing the amount of tacit knowledge and ad hoc manual work can make the workflow easier to access and reproduce.
This is more realistic to achieve if we have the tools for each job which are accessible, possibly open source, and which support the various operations throughout the data pipeline in a more or less integrated manner. Our weapon of choice, the Python ecosystem provides many of these tools, offering a wide range of data manipulation and general purpose libraries which cover many steps in the data preparation and transformation process.
To get an overview of a Pythonic data analysis workflow, let us take a look at a subproject for structuring textual input. It is but one node in the dependency graph, but, as it happens in our fractalesque world of input-operation-output, follows the same pattern.
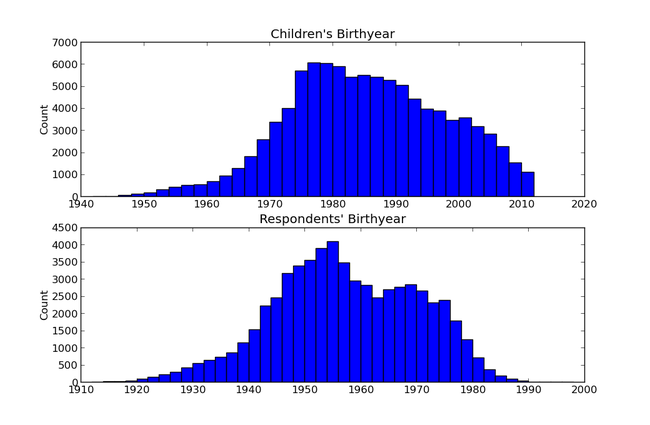
As raw data we have biographical information in semi-structured form (organized in fields which often contain free text) scattered in HTML files. We would like to extract the fields and values, combine them into a dataset, clean the data, then process the text, perform some statistical analysis and, incidentally, display the resulting summaries. In short, we would like to get to this:
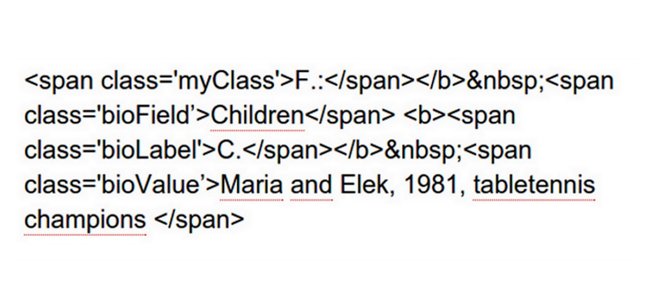
from a lot of this:
A sample process in Python:
- To extract data from HTML, we use the beautifulsoup4 third-party library.
- We perform health check of data with pandas, a powerful data analysis library, which offers data cleaning tools for removing duplicates and handling missing values.
- As the data is in shape, we move on to processing it using Python’s text analysis tools. This mainly involves slicing and gluing strings, exact pattern matching with regular expressions, fuzzy matching - for taming the ubiquitous typos - with difflib. These are all contained in the Python standard library.
- Once we have some structured data we can turn back to pandas for analysis, such as getting distributions of values or other descriptive statistics.
- In case we need visualization, 2D figures can be dynamically generated with the matplotlib library. Matplotlib is also partially integrated in pandas.

