CEU MicroData

Read this first

Which binary classification model is better?

by János K. Divényi

Receiver Operating Characteristic curve
is a great tool to visually illustrate the performance of a binary classifier.
It plots the true positive rate (TPR) or the sensitivity against the false
positive rate (FPR) or 1 - specificity. Usually, the algorithm gives you a
probability (e.g. simple
logistic regresssion),
so for classification you need to choose a cutoff point. The FPR-TPR pairs for
different values of the cutoff gives you the ROC curve. Non-informative
algorithms lie on the 45-degree line, as they classify the same fraction of
positives and negatives as positives, that is TPR = TP/P = FP/N = FPR.

But what if you want to compare two algorithms which give direct classification,
i.e. you have only two points in the plot? How to decide whether algorithm (2)
is better than algorithm (1)?

roc.png

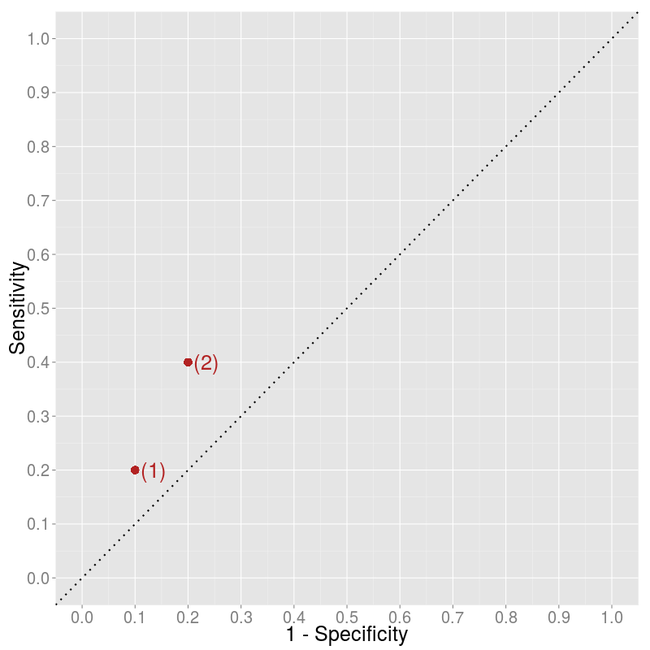
It is clear that algorithm (2) classifies more items as positive...

Continue reading →


Even Amazon needs economists

by Miklós Koren

amazon-drone.png

Suppose you’re Jeff Bezos contemplating a radical new thing for Amazon customers. How would you decide whether it’s worth it? Your engineers might put together a working prototype, roll it out to a bunch of randomly selected customers and do some A/B testing. After your data science team has crunched the numbers, you have your answer: the average customer will spend $X more on Amazon. X>Y, so you decide to scale up.

Not so fast. Without a model, no amount of A/B testing (or, for the science community, randomized control trials) and no amount of observational data are going to tell you how your customers will behave when they encounter something radically new. Models are useful for thinking about changes that have not happened before. A model might be a simple mathematical relationship summarized in a few formulas, a statistical model making assumptions about...

Continue reading →


Python in service of reproducibility

by Rita Zágoni

The degree to which certain aspects of a research are reproducible depend on many factors. For intstance, in a complex research workflow it is hard to automate all the steps ranging from data preparation through analysis to packaging of data and code. Reducing the amount of tacit knowledge and ad hoc manual work can make the workflow easier to access and reproduce.

This is more realistic to achieve if we have the tools for each job which are accessible, possibly open source, and which support the various operations throughout the data pipeline in a more or less integrated manner. Our weapon of choice, the Python ecosystem provides many of these tools, offering a wide range of data manipulation and general purpose libraries which cover many steps in the data preparation and transformation process.

To get an overview of a Pythonic data analysis workflow, let us take a...

Continue reading →


Reproducible plumbing

by Miklós Koren

“I spend more than half of my time integrating, cleansing and transforming data without doing any actual analysis.” (interviewee in the seminal Kandel, Paepcke, Hellerstein and Heer interview study of business analytics practices)

In fact, my estimate is that about 80 percent of the work I do in an empirical research project is about getting, transforming, merging, or otherwise preparing data for the actual analysis.

This part of the research, which, for lack of a better word, I will call plumbing, should also be reproducible. Journal referees, editors and readers have come to expect that if I make a theoretical statement, I offer a proof. If I make a statistical claim, I back it up by a discussion of the methodology and offer software code for replication. The reproducability of plumbing, however, hinges on author statements like “we use the 2013 wave of the World...

Continue reading →


2+2<4

by Krisztián Fekete

Being precise in describing how we achieve a result is hard.

It is not optional, though. Let’s look at the inequality 2+2<4.
Since we have learnt 2+2=4 in primary school, the inequality looks strange. It might become true, though, if we extend it with further information–what the units are and what we mean by the + operation.

2+2<4 might be a short-hand for some mud-making specialists for 2 liters of sand mixed with 2 liters of water gives less than 4 liters of mud, but no one else except the mud-makers would understand it (we get less than 4 liters of mud, as the sand drinks up some water).

For a result to be meaningful and reproducible, both input (such as 2 liters of sand and 2 liters of water) and operation (such as mixing the two substances) are important to be given explicitly, otherwise we will have not have the expected result (mud with a total volume of...

Continue reading →


Looking for a post office? How about a 150,000 of them?

by Miklós Koren

In a recent project, we proxy 19th-century local economic development with the number of post offices in the neighborhood. We have downloaded all historical post office names and dates from Jim Forte’s Postal History (with his permission) to create a geospatial database.

How many post offices were there in Kings County, NY, in 1880? In answering this question, we faced a computational challenge: spatially querying 150,000 points is not trivial. The naive algorithm would go through all points and make a spatial comparison with the polygon: “Is this point inside the polygon?” This is clearly an inferior solution. When we asked QGIS to calculate the number of post offices by counties, it hadn’t finished in three hours. Maybe I am impatient, but this seemed unacceptable to me. So I started researching the quadtree algorithm.

The basic idea of a quadtree is that it splits...

Continue reading →